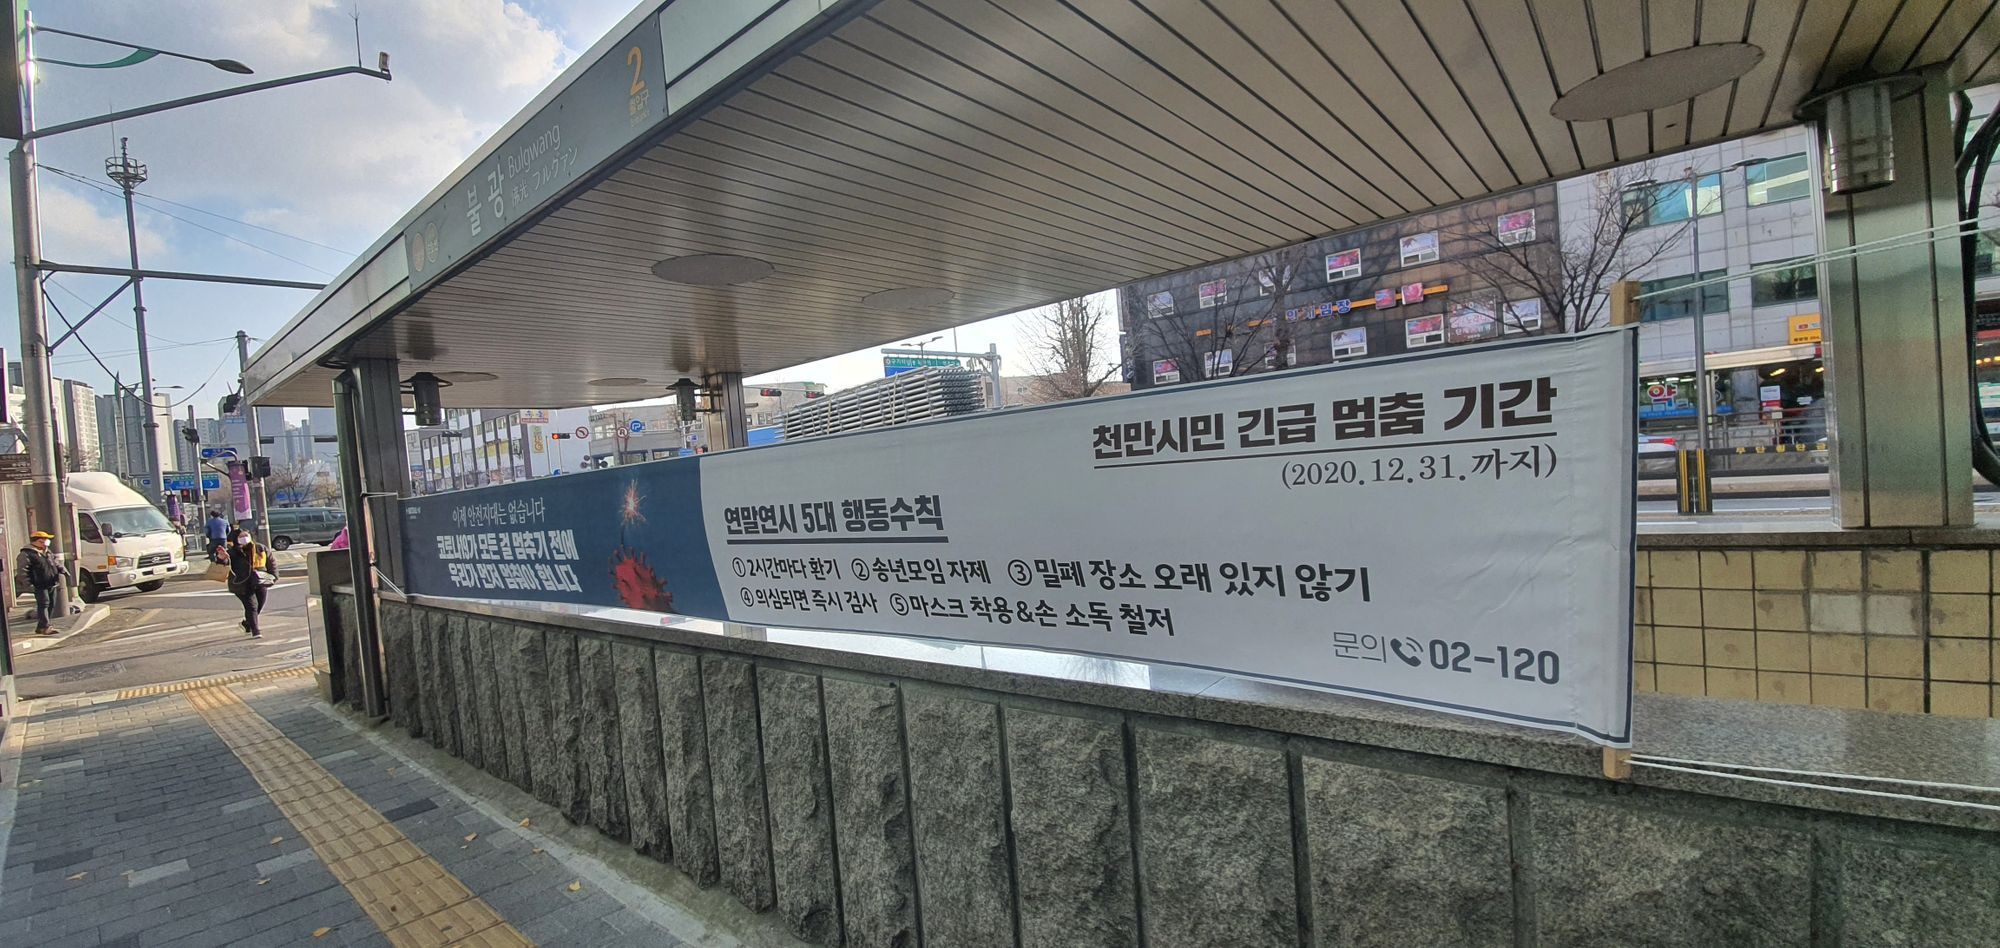
Photo: Public advisory banner at a Seoul subway station urging voluntary compliance with social distancing measures. Credit: the Blue Roof.
Below is an op-ed contribution by Mr. Shin Su-hyeon 신수현, a data and policy analyst who previously worked for the Seoul Metropolitan Government 서울시청. Mr. Shin’s research focuses on data for policy, voting behaviors and inequality issues.
South Korea’s public data is very open, and obsessively precise in certain areas. One such area is the subway ridership in the capital region 수도권. This data is collected in real time, and is made public each week through the local government. (Same is true for bus ridership data.) I believe this data reflects the reality better than the mobility data from Google or Apple that are often used to show people’s movement, for the simple reason that the ridership data is not an estimate, but an actual measurement.
Reviewing the Seoul subway ridership number for 2020 is one way of seeing South Korea’s pandemic fatigue, of the kind the World Health Organization Europe previously reported. Compared to the two previous peaks in COVID-19 cases, voluntary social distancing is less effective in the current, third peak of the outbreak. This illustrates the challenge that South Korea’s public health authorities are facing.
Each week, approximately 50m people ride the subway in the Seoul metropolitan area. (The population of the capital region is approximately 25m.) During the pandemic, the number of riders fluctuated - sometimes voluntarily in response to the number of new COVID-19 cases in the news, and sometimes involuntarily based on partial lockdowns and work-from-home guidances. Diagram 1 below shows this fluctuation:

Diagram 1: Seoul subway ridership and the number of COVID-19 cases. Credit: Shin Su-hyeon.
The solid black line indicates the 2020 ridership data. (For comparison, I included the ridership data for 2018 and 2019 in dotted lines.) We can see that there are five drop-offs, or “cliffs”, in the solid black line. Two of the five cliffs are annually recurring: they are the major holidays, Lunar New Year 설날 and Chuseok 추석, during which people leave the city. In other words, there were three “pandemic cliffs.” In the lower part of the diagram, I added the weekly number of confirmed and active COVID-19 cases for South Korea as a whole and for the Seoul metro area (Seoul 서울, Incheon 인천 and Gyeonggi-do 경기도 Province), to show how the ridership reacted to the increase in the number of infections.
The first cliff is from Week 8 to Week 10, when the Daegu 대구 outbreak happened. Most of the COVID-19 cases happened outside of Seoul. (In fact, the number of daily new cases in the Seoul metro area was fewer than 19.) Yet the Seoul residents were shocked by the outbreak; the ridership, which normally should gradually increase as schools open, dropped off severely. At Week 10, at the bottom of the trough, the ridership number was 30.6m, a 43.5% year-over-year decrease. In other words, nearly half of the subway riders either did not move, or took a different mode of transportation.
Then, as we know, South Korea successfully quelled the first outbreak. Summer came; daily case number dropped to fewer than 50 a day on average. But even still, people did not return to the subway. There was no V-shaped or U-shaped recovery, only a very gradual increase. This means that the post-coronavirus city did not “return to normal”; rather, it was re-invented into something else. (I hope to discuss this point further in a later contribution.) This trend continues until the August doomsday.
The second cliff happens from Week 34 to Week 36. Political rallies held by conservative evangelicals sparked the second wave of the pandemic. (You can check out TBR’s report on that incident here.) The ridership at Week 36, again at the bottom of the trough, was 29.7m, or a year-over-year drop-off of 41.5%. And now, we are at the beginning stage of the third cliff. Diagram 2 below shows year-over-year change in ridership per week in order to show the overall trend. Just for fun, I added a few comments showing what was going through my mind as I read the graph:

Diagram 2: Year-over-year change in the weekly Seoul metro area subway ridership. Credit: Shin Su-hyeon.
The first two cliffs are textbook cases of a natural experiment. The government never restricted the use of the subway throughout the pandemic. Therefore, through repeated instances of ridership decrease following an outbreak, we know that: (1) we can achieve up to a little more than 40% decrease in ridership without shutting down the subway, and; (2) it takes about two weeks to achieve the drop. But the current cliff is different, as you can see in Diagram 3 below:
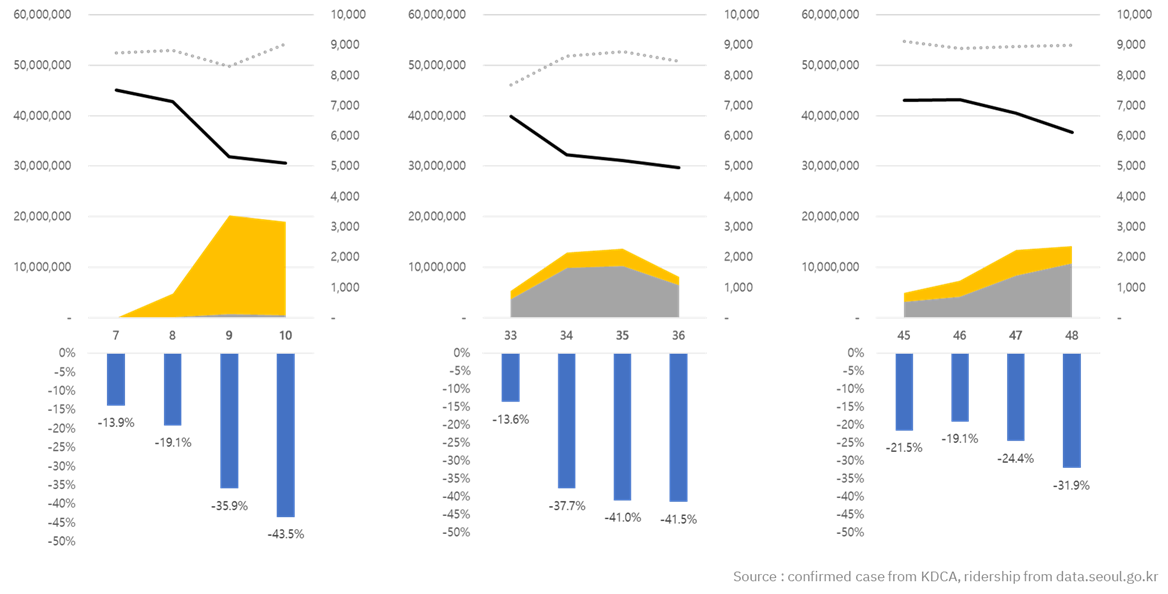
Diagram 3: the three "Pandemic Cliffs." Credit: Shin Su-hyeon.
This diagram zooms in on the three pandemic cliffs. (The lines and graphs follow the same legend as Diagram 1.) The third wave of the COVID-19 outbreak began in Week 46, or mid-November. But the ridership does not drop by much in Week 47. Even at Week 48, the year-over-year drop is only around 32% - not quite the 40% drop achieved in the second week of the earlier cliffs. The total ridership remains around 40m, or 10m more than the bottom of the first two cliffs. Meanwhile, the number of active coronavirus cases in the capital region is not decreasing. This differential is the pandemic fatigue: the Seoul metro area residents are no longer responsive to the increase in the number of infections, at least not to the same degree as before.
This shows the difficulty faced by the Korean government: they must make up for the slack in voluntary compliance by introducing more restrictive measures. It must urge companies to institute work-from-home programs and implement stricter social distancing guidelines to limit the people from gathering. (As I write this, the Seoul metropolitan area raised their social distancing guideline to Level 2.5, the last level before a full-scale shutdown of all businesses except essential ones.) The problem is - everyone is tired already, and more coercive measures, while necessary, does not help the fatigue.