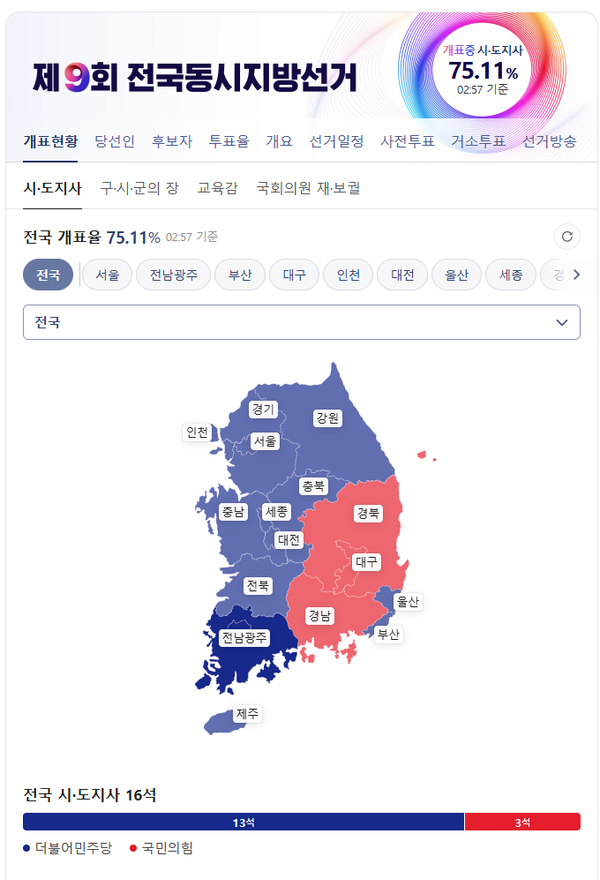
Graph: Neighborhoods that voted Dem-PPP-PPP in 2016-2020-2022 saw the greatest increase in cumulative real estate tax. Credit: Korea Institute of Local Finance.
Quantitative postmortem analysis of the presidential election shows the same conclusion each time: real estate swung the election, especially in Seoul. (See previous coverage, “The Real Estate Election.”)
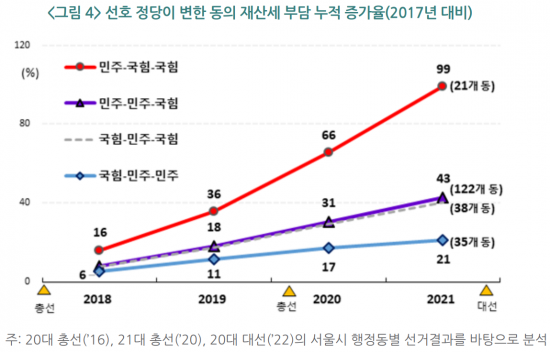
A new study by the Korea Institute of Local Finance 한국지방세연구원 broke down Seoul’s 426 neighborhoods (dong 동) by their voting trends in the 2016 Assembly election, the 2020 Assembly election, and the 2022 presidential election, categorizing them as either consistent People Power Party 국민의힘 neighborhoods, consistent Democratic Party 민주당 neighborhoods, or neighborhoods that switched allegiance.
The PPP areas, compared to the Dem areas, showed a significant increase in property tax due to Seoul’s rising home value: 84% increase between 2017 and 2021 compared to 24% increase in the same time period in the Democratic neighborhoods. The increase was even more severe among neighborhoods that supported the Democrats in 2016, then switched to the PPP in 2020 and beyond: a 99% increase in property taxes between 2017 and 2021.
A significant number of neighborhoods - 122 out of 426 - voted Democratic through 2020, then switched to the PPP in 2022; these areas saw a 43% increase in property taxes, significantly higher than the neighborhoods that stayed Democratic.